AR denial management is the systematic process of identifying, analyzing, appealing, and resolving denied insurance claims in medical billing — with the goal of recovering rightful reimbursement and preventing future revenue loss. It covers everything from root cause analysis of CARC/RARC codes to formal appeals, clean claim resubmission, and front-end denial prevention. For any healthcare practice, it’s the backbone of a healthy revenue cycle.
Table of Contents
- What Is AR Denial Management?
- AR Management vs. Denial Management — Key Differences
- Claim Rejection vs. Claim Denial — What’s the Difference?
- Why Denial Management Matters in Revenue Cycle Management
- What Causes Medical Claim Denials? (Top 10 Reasons)
- The Denial Management Process — Step by Step
- Common Denial Codes (CARC/RARC) Explained
- AR Denial Management KPIs & Industry Benchmarks
- How to Reduce Claim Denials: Prevention Strategies
- Which Medical Specialties Are Most Affected?
- AR Denial Management Across the U.S. — What Varies by State
- Top 12 FAQs About AR Denial Management
- Key Takeaways
1. What Is AR Denial Management in Medical Billing?
Here’s a number that reframes the whole conversation: the U.S. healthcare industry processes over 3 billion medical claims per year, and an estimated 200–300 million of them are denied on first submission. That’s roughly 1 in every 10 claims. For the average medical practice, that number translates directly into delayed cash flow, administrative overload, and in many cases — revenue that’s never recovered at all.
So what’s the mechanism that stands between a denied claim and a paid one? That’s AR denial management.
What Is AR Denial Management?
AR denial management (accounts receivable denial management) is the structured process within medical billing and revenue cycle management (RCM) that identifies why insurance claims were denied, categorizes those denials by type and payer, files formal appeals, corrects and resubmits claims, and implements process changes to prevent recurrence. It operates at the intersection of clinical documentation, billing accuracy, and payer compliance.
The ‘AR’ in AR denial management refers to accounts receivable — the full ledger of money owed to a healthcare provider by insurance payers and patients. Denial management is specifically the sub-discipline that handles the portion of that AR stuck in a rejected or denied state.
Think of it this way: AR management tracks all the money. Denial management fights for the money that’s being withheld.
Together, they form the financial immune system of any medical practice — whether you’re a solo family physician in Georgia, a multi-specialty group in California, or a home health agency in Florida.
📎 Learn more about structured denial workflows
For a deeper look at how a structured denial management workflow is built and implemented, visit the service overview page. →
2. AR Management vs. Denial Management — What’s the Difference?
These two terms get tangled constantly in healthcare billing discussions — even among experienced billing professionals. Here’s how they actually differ:
| Dimension | AR Management | Denial Management |
|---|---|---|
| Scope | All outstanding balances across all claims | Only denied, rejected, or underpaid claims |
| Primary Goal | Reduce days in AR; accelerate collections | Overturn denials; recover withheld revenue |
| Trigger | Ongoing billing cycle activity | Payer denial or rejection event |
| Key Tools | AR aging reports, follow-up workflows, KPI dashboards | CARC/RARC analysis, appeal letters, payer portals |
| Metrics | Days in AR, collection rate, aging buckets | Denial rate, appeal overturn rate, FPRR |
| Who Performs It | Billing coordinators, AR specialists | Denial analysts, billing managers, coders |
| Time Horizon | Proactive and continuous | Reactive to denied claims + preventive feedback loop |
The most effective revenue cycle operations treat these as integrated, not separate. AR management surfaces the problem; denial management solves it — and then feeds learnings back to prevent the next one.
A high days-in-AR metric is often the first signal that denial rates are creeping up. And an aging AR report full of 90+ day claims is frequently a denial management problem disguised as a collections problem.
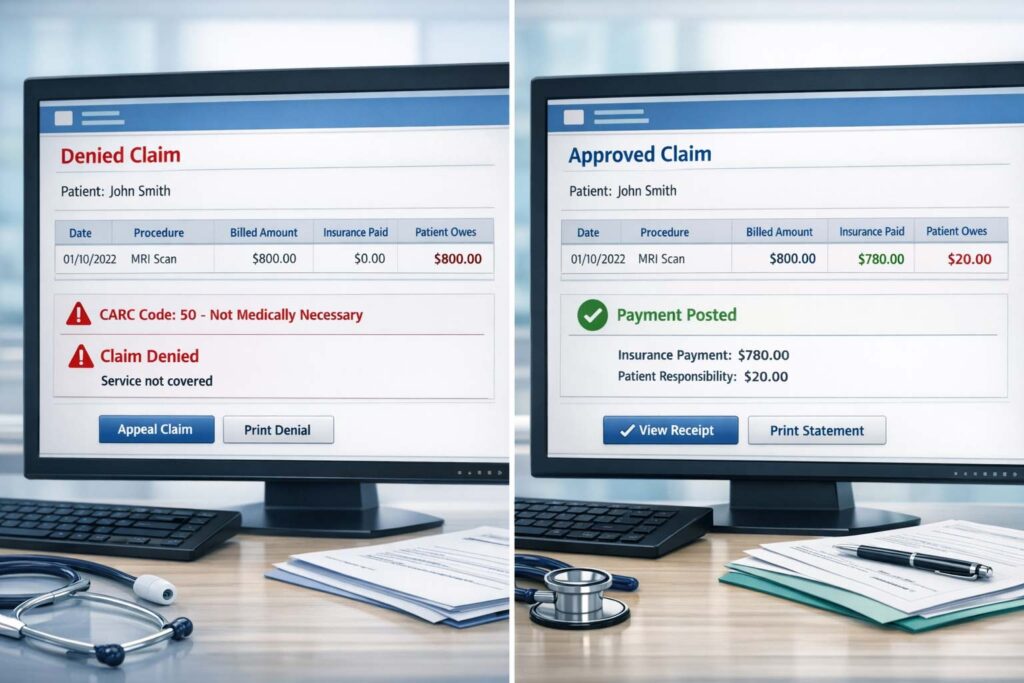
3. Claim Rejection vs. Claim Denial — What’s the Difference?
What is the difference between a claim rejection and a claim denial?
A claim rejection occurs at the clearinghouse level — the claim never reaches the payer because it contains a formatting or data error (e.g., missing NPI, invalid date format). A claim denial occurs after the payer has received and processed the claim, but refuses to pay — due to medical necessity, eligibility, authorization, or coding reasons. Rejections are fixed and resubmitted; denials require appeals or corrections through the payer’s formal process.
This distinction trips up even experienced billing teams — and it matters because the resolution path is completely different.
| Factor | Claim Rejection | Claim Denial |
|---|---|---|
| Where it’s caught | Clearinghouse (before payer adjudication) | At the payer (after adjudication) |
| Does payer see it? | No — never reaches the payer | Yes — payer reviewed and refused payment |
| How it appears | Clearinghouse error report / 277CA transaction | Explanation of Benefits (EOB) / ERA with CARC code |
| Common causes | Missing NPI, invalid date format, wrong payer ID, bad taxonomy code | Authorization missing, medical necessity, timely filing, coding errors |
| Resolution path | Fix the data error; resubmit through clearinghouse | File appeal OR correct claim and resubmit to payer |
| Timely filing impact | The clock may still be running — fix quickly | Appeal windows now apply — deadlines are strict |
| Revenue impact | Temporary delay if caught fast; permanent loss if missed | Permanent loss if appeal not filed before deadline |
Why does this matter for AR denial management? Because rejected claims don’t generate CARC codes — they generate clearinghouse error reports. A practice that only monitors payer-level denial activity may be completely blind to a pattern of clearinghouse rejections silently delaying revenue. Both need to be tracked, and both need a workflow.
A practical rule of thumb: if you see the claim on an ERA with a CARC code, it’s a denial. If you never see it on an ERA at all — check your clearinghouse rejection reports. The claim probably never made it through payer adjudication.
4. Why Denial Management Matters in Revenue Cycle Management
Why Is Denial Management Important?
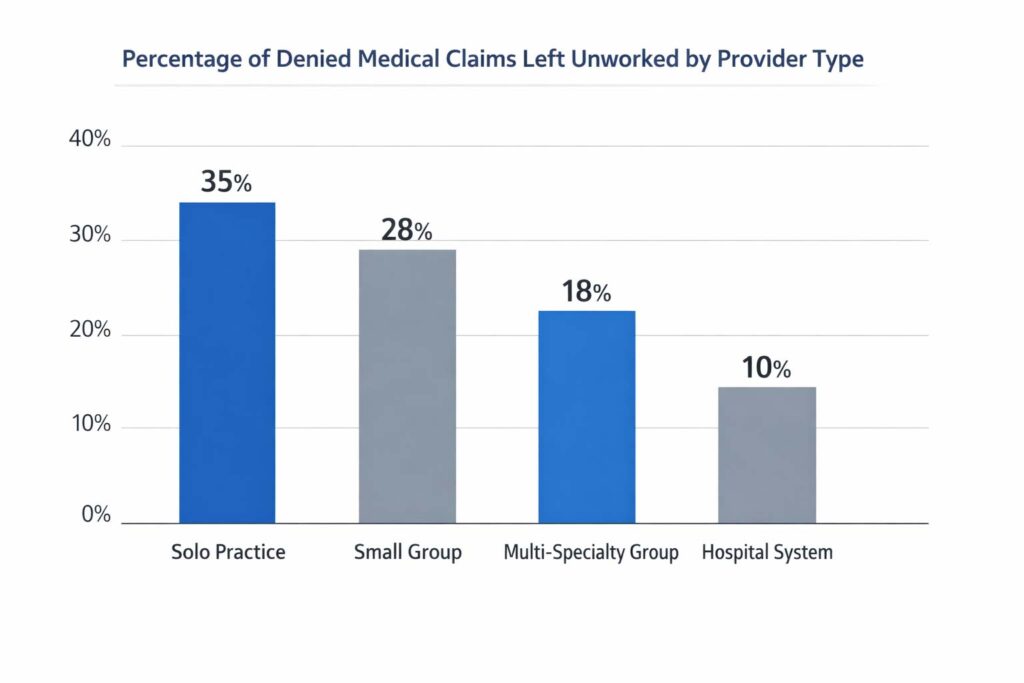
Denial management is critical in revenue cycle management because denied claims represent real, earned revenue being withheld — and without active follow-up, a significant portion of that revenue is permanently lost. Studies show that up to 65% of denied claims are never reworked. At an average cost of $25–$117 per claim to rework, denial volume also creates substantial administrative overhead that compounds across a practice’s billing operation.
Beyond the dollar figures, denial management matters for three structural reasons:
- It protects revenue integrity — ensuring payers pay what contracts obligate them to pay
- It surfaces systemic billing and documentation failures — turning individual claim errors into process improvements
- It directly impacts clean claim rate and first-pass resolution rate (FPRR) — two of the most predictive indicators of billing department performance
Revenue cycle denial management isn’t a back-office cleanup task. It’s a core operational function that touches coding, clinical documentation, eligibility verification, prior authorization, and payer contracting simultaneously.
For practices in high-volume states like Texas, New York, and Illinois — where payer mix complexity is high — the financial stakes of weak denial management are disproportionately large.
5. What Causes Medical Claim Denials? (Top 10 Reasons)
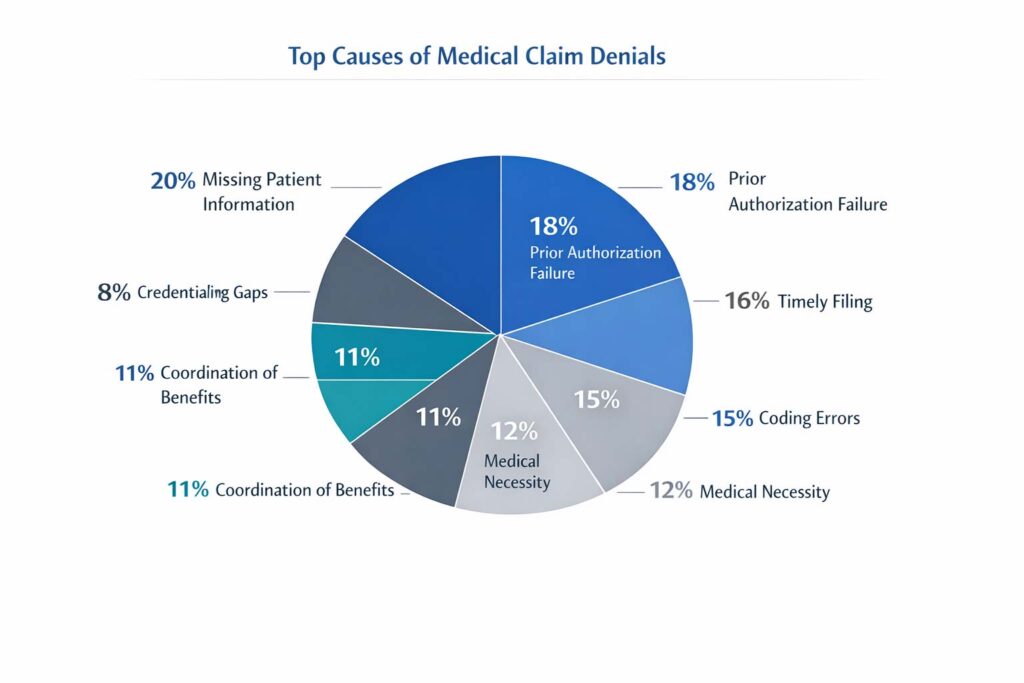
Understanding the denial lifecycle in healthcare starts with the root cause. Most denials fall into a small number of recurring categories — many of which are entirely preventable.
| Rank | Denial Cause | Type | Preventable? |
|---|---|---|---|
| 1 | Missing or invalid patient information | Administrative | Yes |
| 2 | Prior authorization not obtained or expired | Clinical/Process | Yes |
| 3 | Timely filing deadline exceeded | Administrative | Yes |
| 4 | Duplicate claim submission | Administrative | Yes |
| 5 | Incorrect CPT, ICD-10, or modifier codes | Coding | Yes |
| 6 | Medical necessity not sufficiently documented | Clinical | Partially |
| 7 | Non-covered service or benefit exhaustion | Payer Policy | Partially |
| 8 | Coordination of Benefits (COB) conflict | Eligibility | Yes |
| 9 | Provider credentialing or enrollment gap | Administrative | Yes |
| 10 | Payer-specific bundling or edit rules | Coding/Policy | Partially |
Notice something? The majority of the top denial causes are administrative — not clinical. That means most denials aren’t about the care itself. They’re about process failures in how care gets documented, coded, authorized, and billed.
This is what makes denial analysis in RCM so powerful: when you can see patterns across your denial data — by payer, by provider, by code, by location — you can trace the systemic failures and fix them upstream, before claims are ever submitted.
Practices in states like Arizona and Minnesota, for instance, often see higher prior authorization denial rates due to specific Medicaid managed care requirements that differ from national commercial payer policies.
6. The Denial Management Process — Step by Step
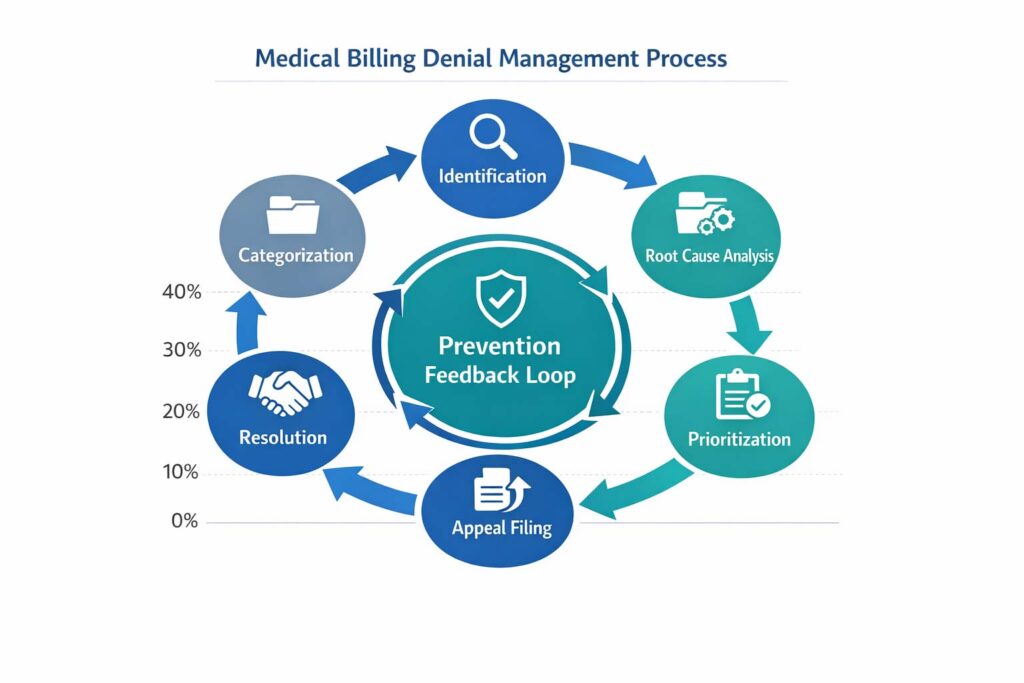
The denial management process is the structured sequence of steps that transforms a payer denial into a resolved, paid claim. It runs from initial identification via ERA (Electronic Remittance Advice) through root cause analysis, appeal or correction, resolution, and — critically — prevention feedback back into the front-end billing workflow.
The denial management workflow isn’t a single task — it’s a structured cycle with distinct stages. Here’s how a well-run process operates:
| Stage | Action | Output |
|---|---|---|
| 1. Identification | Flag denied/rejected claims via ERA, clearinghouse, or payer portal | Denial work queue populated |
| 2. Categorization | Classify by CARC/RARC code, payer, denial reason, and claim type | Structured denial log for analysis |
| 3. Root Cause Analysis | Determine whether denial is clinical, administrative, coding, or payer error | Denial cause tagged per claim |
| 4. Prioritization | Sort by dollar value, payer deadline, and appeal window | High-value and time-sensitive claims escalated |
| 5. AR Follow-Up | Contact payer or apply fix (code correction, documentation, auth proof) | Corrected claim or appeal initiated |
| 6. Appeal Filing | Submit formal appeal with supporting clinical/admin documentation | Appeal submitted within timely filing window |
| 7. Resolution & Posting | Payment received and posted, or escalated to secondary review | Claim resolved or escalated |
| 8. Denial Prevention Feedback | Feed denial patterns back to front-end billing, coding, and clinical teams | Reduced future denial rate |
Step 8 is where most practices fall short. Working individual denials is reactive billing. Using denial data to fix upstream processes is revenue cycle optimization. The difference between the two is often tens of thousands of dollars annually.
For home health agencies in Michigan and Maryland — where documentation-heavy claim types are common — having a structured denial prevention feedback loop between the clinical and billing teams is especially critical to maintaining a clean claim rate above 95%.
📎 Explore how denial workflows are implemented in practice
Want to see how a full denial management system operates across different specialties and payer types? →
Is your denial rate costing you revenue?
If your practice’s denial rate exceeds 5% or AR aging shows >20% in the 90+ day bucket, performing a structured denial audit can often uncover recoverable revenue and process gaps that reduce financial leakage.
7. Common Denial Codes (CARC/RARC) Explained
CARC and RARC codes are the standardized language payers use to explain every claim denial. CARC (Claim Adjustment Reason Code) identifies the primary denial reason; RARC (Remittance Advice Remark Code) adds specificity. Reading these codes accurately on an Explanation of Benefits (EOB) is the foundation of fast, effective denial resolution.
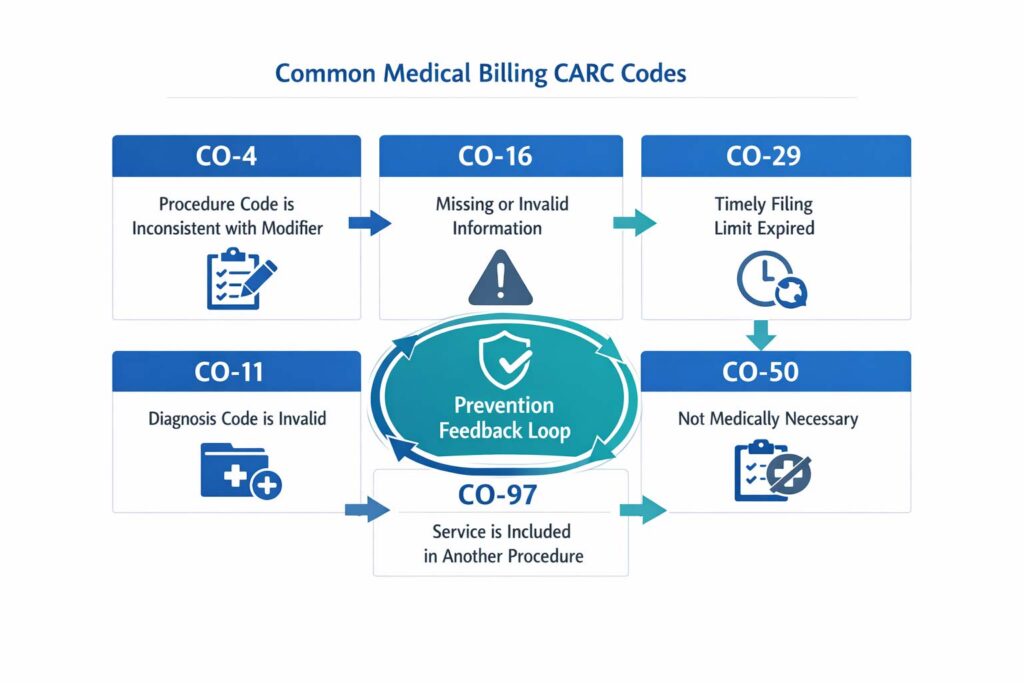
Every denial comes with a code. Understanding those codes is the difference between a fast resolution and a claim that ages past its appeal window. Here are the most frequently encountered CARC codes in medical billing:
| CARC Code | Denial Reason | Resolution Strategy | Common in These Specialties |
|---|---|---|---|
| CO-4 | Inconsistent modifier or procedure code | Verify modifier against CPT and payer policy, resubmit | Anesthesiology, Surgery, Orthopedic |
| CO-11 | Diagnosis code inconsistent with procedure | Review ICD-10/CPT pairing, correct and resubmit | Behavioral Health, Primary Care |
| CO-16 | Missing or insufficient claim information | Identify the missing element, add it, resubmit | All specialties — very common |
| CO-29 | Timely filing deadline exceeded | Appeal with proof of original submission date | Any specialty with payer lag |
| CO-50 | Not medically necessary per payer policy | Submit clinical documentation, letter of medical necessity | Dermatology, Home Health, OT/PT |
| CO-97 | Service included in primary procedure (global) | Verify global period; unbundle only if appropriate | Orthopedic, Surgery, Anesthesia |
| CO-167 | Diagnosis code not on covered list | Correct ICD-10 code, verify payer coverage policy | All specialties |
| PR-1 | Patient deductible not yet met | Bill patient directly for deductible balance | High-deductible plan patients |
| CO-204 | Service not covered by this plan | Verify benefits, consider patient responsibility | Home Health, DME, Behavioral Health |
RARC (Remittance Advice Remark Codes) often accompany CARC codes to add more detail about why a denial was issued. For example, N130 (‘Consult plan benefit documents…’) or N575 (‘Mismatch between the submitted ordering/referring provider…’) can refine the resolution path significantly.
Tracking payer-specific denial trends by CARC code over time is one of the most powerful tools in denial analysis — and one of the clearest indicators of where a practice needs process improvement.
8. AR Denial Management KPIs & Industry Benchmarks
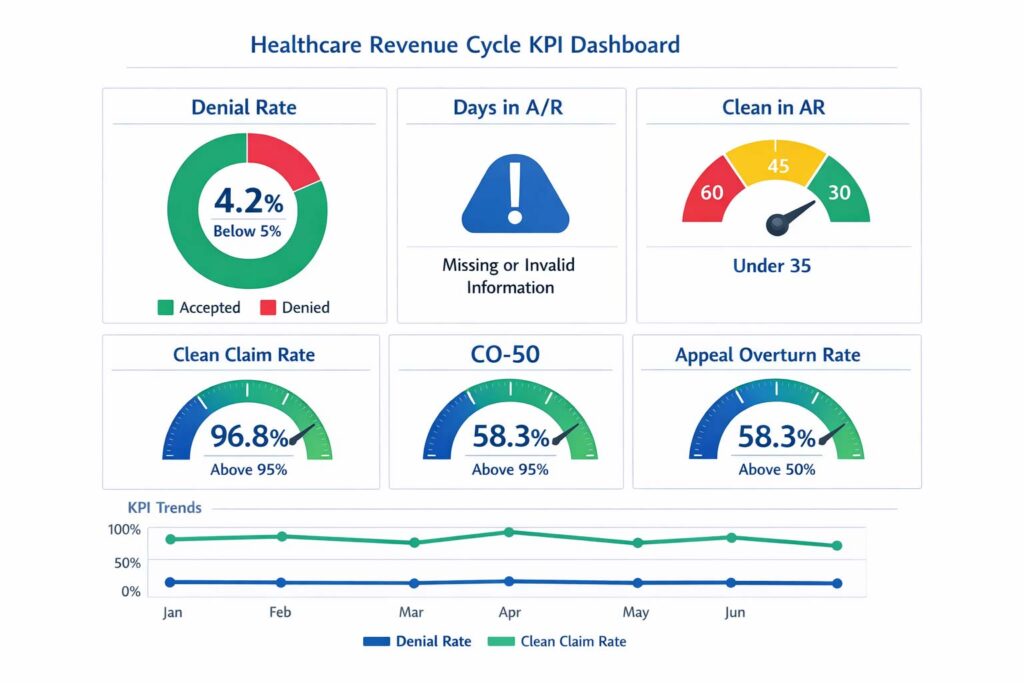
AR denial management KPIs are measurable performance indicators that track how efficiently denied claims are identified, appealed, and resolved. These metrics directly impact cash flow, collection rates, and overall revenue cycle efficiency — and they’re the most reliable way to know whether your denial management process is actually working. Revenue Cycle Management basics and KPI reference →
| KPI | Industry Benchmark | What It Signals |
|---|---|---|
| Denial Rate (First Submission) | < 5% | Share of claims denied before rework — core billing efficiency signal |
| Days in AR (Overall) | < 35 days | Avg time from claim submission to payment received |
| Clean Claim Rate | > 95% | Claims passing without errors on first submission |
| First-Pass Resolution Rate (FPRR) | > 90% | Claims paid without rework — reflects front-end billing quality |
| Appeal Overturn Rate | > 50% | Percentage of filed appeals resulting in payment — measures appeal quality |
| AR Aging > 90 Days | < 15–20% of total AR | Older AR signals unworked denials or systemic payer delays |
| Cost to Collect | < 3–4% of net collections | Total billing cost per dollar collected — efficiency benchmark |
| Underpayment Recovery Rate | Varies by payer | Revenue recovered through payer contract compliance audits |
If your AR aging report shows more than 20% of balances beyond 90 days, that’s typically a denial management problem, not a collections problem. The claims are there — they just haven’t been worked.
Two often-overlooked metrics: underpayment recovery rate and cost to collect. Most practices focus entirely on denied claims while missing the quieter drain of payers reimbursing below contracted fee schedule rates. Systematic underpayment recovery — through payer contract audits and variance tracking — can surface meaningful revenue that’s been silently eroding for months without triggering a formal denial at all.
9. How to Reduce Claim Denials: Prevention Strategies
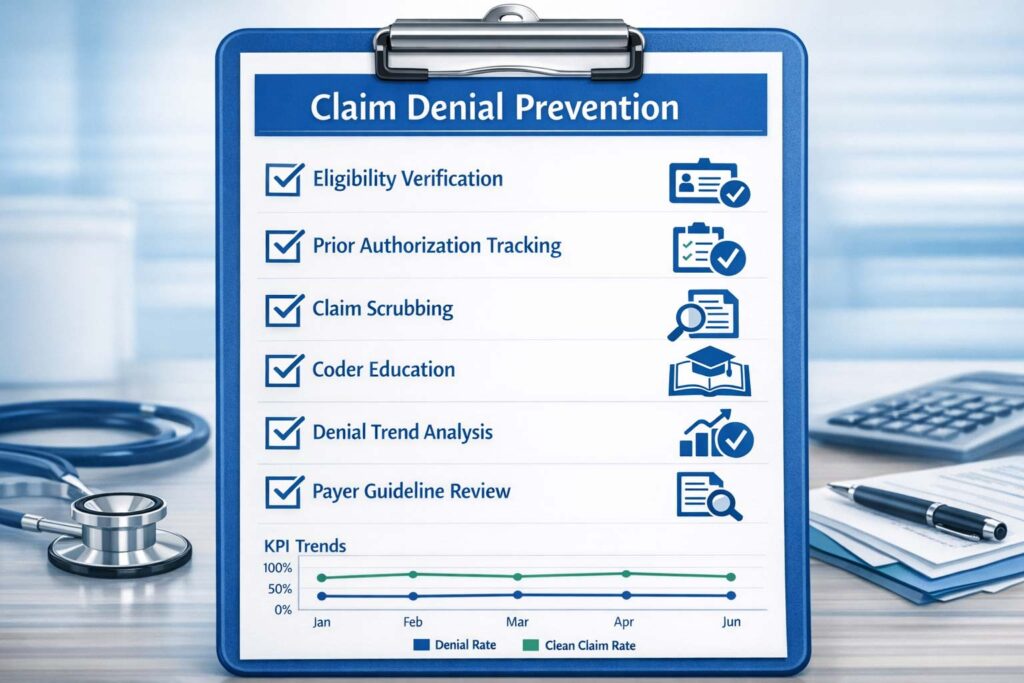
How Can Healthcare Providers Reduce Claim Denials?
Healthcare providers can reduce claim denials by implementing front-end prevention controls: real-time eligibility verification before each visit, proactive prior authorization tracking, claim scrubbing automation before submission, regular coder education on ICD-10/CPT updates, and systematic denial trend analysis to identify recurring patterns. Combining front-end prevention with back-end denial resolution — and using denial data to continuously improve both — is the proven framework for sustained denial rate reduction.
Here are the denial prevention strategies that consistently move the needle:
- Verify insurance eligibility and benefits before every appointment — not just once at registration
- Build a prior authorization tracking system so auths don’t lapse mid-treatment
- Use claim scrubbing software to catch coding and demographic errors before claims reach the payer
- Educate clinical staff on documentation requirements for medical necessity — especially for home health, behavioral health, and PT/OT
- Monitor timely filing windows for every payer in your mix and set internal submission deadlines earlier
- Conduct monthly denial trend analysis by CARC code, payer, and provider to identify systemic issues
- Review payer-specific billing guidelines regularly — especially for Medicaid managed care plans in your state
- Implement a structured denial prevention feedback loop between billing, coding, and clinical documentation teams
Prevention doesn’t eliminate denials entirely — but it can realistically push denial rates from 10–12% down to under 5% within two to three billing cycles when executed systematically.
10. Which Medical Specialties Are Most Affected by Claim Denials?
Every specialty faces denials — but billing complexity, documentation requirements, and payer policy variation mean some specialties carry a disproportionate denial burden. Here’s the landscape:
| Specialty | Primary Denial Drivers | High-Risk CARC Codes | Key Prevention Focus |
|---|---|---|---|
| Family Practice | Preventive vs. diagnostic billing, dual-purpose visits, modifier confusion | CO-4, CO-11, CO-16 | Modifier clarity, split-billing rules, E/M documentation |
| Dermatology | Cosmetic vs. medical classification, biopsy code specificity | CO-50, CO-167 | Medical necessity letters, correct CPT for biopsy type |
| Home Health | OASIS documentation gaps, homebound status, face-to-face requirement | CO-50, CO-16, CO-204 | OASIS accuracy, F2F documentation, prior auth tracking |
| Anesthesiology | Time unit errors, concurrent procedure rules, modifier conflicts | CO-4, CO-97, CO-16 | Time unit audits, base unit verification, anesthesia modifier review |
| Behavioral Health | Session limits, parity compliance, diagnosis code specificity | CO-11, CO-204, PR-1 | Benefit verification, auth tracking, DSM-5 code accuracy |
| Physical Therapy | Medical necessity justification, plan of care lapses, functional reporting | CO-50, CO-16, CO-29 | POC renewal tracking, functional outcome documentation |
| Occupational Therapy | PT/OT service overlap, school-based billing complexity | CO-97, CO-50, CO-4 | Diagnosis-to-procedure specificity, service differentiation |
| Orthopedic | Global period billing, implant/DME carve-outs, bundling edits | CO-97, CO-4, CO-16 | Modifier 59/XU use, global period tracking, implant documentation |
If your specialty appears in this table with multiple high-risk CARC codes, that’s a sign your denial management process needs specialty-specific protocols — not a generic billing workflow.
11. AR Denial Management Across the U.S. — What Varies by State
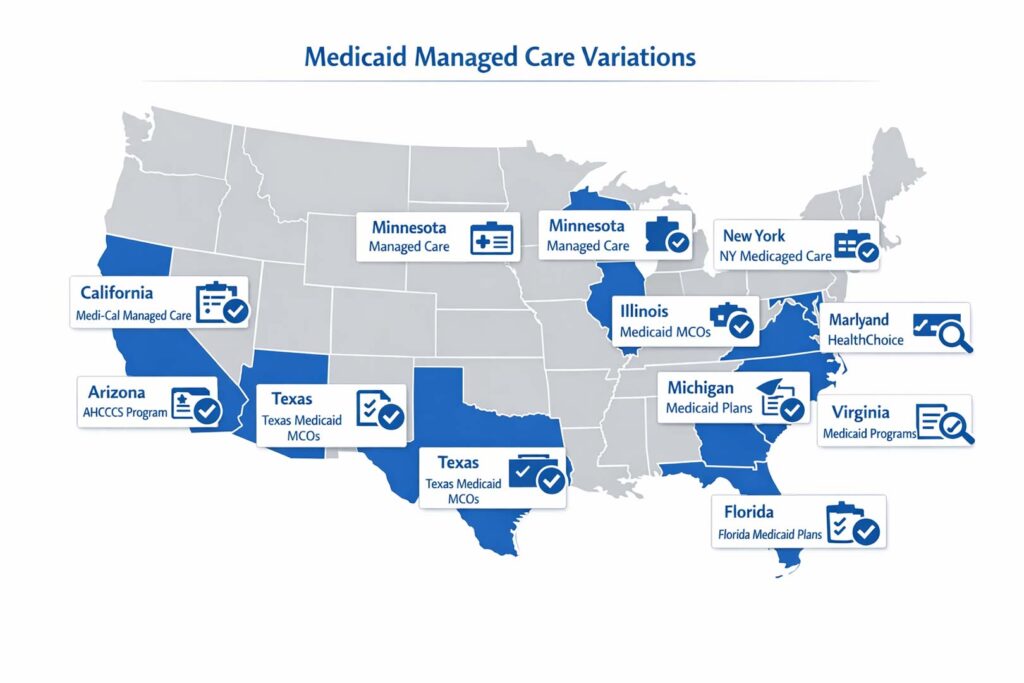
Denial management isn’t one-size-fits-all. Payer mix, Medicaid managed care structure, state-specific billing regulations, and prior authorization requirements all vary significantly by geography. Here’s how that plays out across key states:
| State | Key Billing Environment | Common Denial Risk Factors | Notes for Practices |
|---|---|---|---|
| California (CA) | Large Medi-Cal managed care footprint, many multi-specialty groups | Auth denials, timely filing with delegated groups | Medi-Cal contractor rules vary by county |
| Texas (TX) | Diverse payer mix, large Medicaid managed care market | COB issues, auth requirements for behavioral health | Star Health, CHIP, and Molina have specific billing rules |
| Florida (FL) | High Medicare Advantage penetration, large home health sector | Medical necessity denials, OASIS gaps, DME documentation | FL Medicaid Statewide MMA plan billing varies widely |
| New York (NY) | Complex Medicaid structure, high behavioral health volume | Parity compliance denials, prior auth for psych services | OMH-licensed providers face additional documentation rules |
| Georgia (GA) | CMO-based Medicaid, growing Federally Qualified Health Center market | Auth denials under CMOs (Amerigroup, Peach State, WellCare) | CMO prior auth requirements differ by plan and county |
| North Carolina (NC) | NC Medicaid Transformation (Tailored Plans launch 2023) | Transition-related auth gaps, plan assignment changes | Behavioral health and I/DD services especially affected |
| Arizona (AZ) | AHCCCS managed care, heavy prior auth requirements | Auth expiration denials, concurrent review requirements | AHCCCS fee schedules differ from commercial by specialty |
| Illinois (IL) | Medicaid managed care via HFS, high multi-specialty group density | Timely filing under Cook County payers, COB complexity | CountyCare and IlliniCare have distinct prior auth portals |
| Minnesota (MN) | MHCP (Medical Assistance) with multiple MCOs | Auth denials, anesthesia billing complexity | UCare and HealthPartners have specialty-specific edit rules |
| Michigan (MI) | Medicaid through Healthy Michigan Plan, PT/OT volume high | Auth lapses, functional documentation for PT/OT | BCN and BCBS MI have different prior auth thresholds |
| Maryland (MD) | CRISP HIE integration, high home health and SNF volume | OASIS gaps, face-to-face documentation for home health | MD Medicaid HealthChoice has strict timely filing windows |
| Virginia (VA) | Medallion 4.0 Medicaid managed care, behavioral health emphasis | Auth denials for behavioral health, COB under Medallion | Optima Health and Anthem VA have different auth portals |
Understanding your state’s Medicaid managed care structure, payer-specific denial trends, and billing policy environment is essential context for effective denial management. What works for a Florida home health agency doesn’t necessarily map to a North Carolina behavioral health practice.
📎 See how a full denial management system operates by state
TrueCare RCM serves practices in all 12 states above, with payer-specific denial management workflows tailored to each market. →
12. Top 12 FAQs About AR Denial Management
Below are the most frequently asked questions about AR denial management, optimized for healthcare administrators, billing managers, and practice owners across the U.S. Each answer is structured for quick reference and designed to address the specific language used in real billing workflows.
Q1: What is AR denial management in medical billing?
AR denial management is the process of identifying denied insurance claims, analyzing their root causes using CARC/RARC codes, filing appeals, correcting and resubmitting claims, and implementing prevention strategies to reduce future denials. It’s a core function of revenue cycle management designed to protect a practice’s earned reimbursement.
Q2: What is the difference between AR management and denial management?
AR management oversees all outstanding patient and payer balances across the full billing cycle. Denial management is a targeted subset — focused specifically on claims denied or rejected by payers. AR management reveals that money is owed; denial management fights to collect what’s being withheld.
Q3: Why is denial management important in revenue cycle management?
Because up to 65% of denied claims are never reworked, meaning that revenue is permanently lost. Denial management converts those denied claims into payments — and uses the data to prevent recurrence, reducing future denial rates and improving the overall clean claim rate and days in AR.
Q4: What are the main causes of medical claim denials?
The most common causes are: prior authorization failures, timely filing violations, missing or incorrect patient information, coding errors (CPT/ICD-10 mismatches), medical necessity documentation gaps, duplicate submissions, coordination of benefits conflicts, and provider credentialing/enrollment lapses.
Q5: How does AR follow-up reduce days in AR?
Proactive AR follow-up prevents claims from aging undetected. By contacting payers early, tracking claim status in real time, and resolving denials or errors quickly, billing teams reduce the average time from claim submission to payment — lowering days in AR toward the industry benchmark of under 35 days.
Q6: What are common denial codes in medical billing?
The most common CARC codes include CO-4 (modifier inconsistency), CO-11 (diagnosis/procedure mismatch), CO-16 (missing claim information), CO-29 (timely filing exceeded), CO-50 (medical necessity denied), CO-97 (bundled procedure), and CO-167 (non-covered diagnosis). Each signals a specific fix pathway.
Q7: How can healthcare providers reduce claim denials?
Through front-end denial prevention: real-time eligibility verification, prior authorization tracking, claim scrubbing before submission, coder education on ICD-10/CPT updates, payer-specific billing guideline reviews, and monthly denial trend analysis to identify and resolve recurring patterns at the source.
Q8: What is the average denial rate in healthcare?
The industry benchmark for an acceptable denial rate is under 5% of claims submitted. Many practices, however, operate at denial rates of 8–15% without realizing it. Denial rates above 5% are a significant source of revenue leakage and a strong indicator that billing process improvements are needed.
Q9: What is the role of AR aging reports in denial management?
AR aging reports categorize outstanding claims into 0–30, 31–60, 61–90, and 90+ day buckets. They help billing teams prioritize follow-up, identify stuck claims that may be unworked denials, and flag systemic payer delays. A high percentage of AR over 90 days is a leading indicator of a denial management breakdown.
Q10: What is the claim denial appeal process?
The denial appeal process follows five steps: (1) review the CARC/RARC denial code to understand the specific reason, (2) gather supporting documentation (clinical notes, auth records, EOB), (3) draft a formal appeal letter citing contract language or clinical evidence, (4) submit within the payer’s appeal deadline, and (5) track and follow up on appeal status.
Q11: How long should AR claims remain open before escalation?
General guidance: claims should be followed up within 14–21 days of no response, and escalated to a formal appeal or supervisor review by 45–60 days depending on payer. Claims approaching 90 days without resolution should be escalated immediately — both to protect appeal rights and to avoid timely filing deadline expiration on resubmissions.
Q12: What are denial prevention strategies in medical billing?
The most effective denial prevention strategies are: pre-visit insurance eligibility verification, prior authorization tracking workflows, automated claim scrubbing, regular coding education, systematic denial trend analysis by CARC code and payer, and structured feedback loops that route denial data back to the clinical documentation and front-end billing teams.

13. Key Takeaways
What every healthcare billing professional should walk away knowing:
- AR denial management is not a back-office cleanup task — it’s a core revenue cycle function that directly impacts cash flow, billing efficiency, and practice profitability
- Most claim denials are administrative and preventable — which means denial management also drives process improvement across coding, documentation, and eligibility workflows
- The denial management process runs in a loop: identify → categorize → analyze → appeal → resolve → prevent. Missing the prevention step leaves the root cause unaddressed
- Key benchmarks to track: denial rate < 5%, days in AR < 35, clean claim rate > 95%, AR over 90 days < 15–20%
- Denial drivers vary by specialty and by state — effective denial management requires specialty-specific protocols and awareness of local payer environments
- CARC and RARC codes are the roadmap for resolution — understanding them is fundamental to fast, accurate denial management
Schedule a free denial diagnostic
See if your practice is leaving revenue on the table — our team can help you interpret denial patterns and AR aging data.